This command displays a chart of the selected contract in the DOM.
Click on the icon in the DOM to display an independent window of the selected contract as a chart. Refer to the Figures below.
Histogram
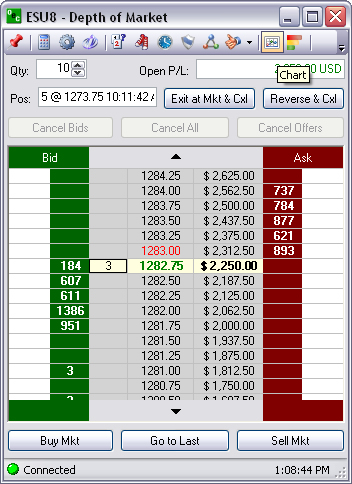
This is the command that displays the histogram on the DOM. Refer to the Figures below.
To display the histogram on the DOM, click on the icon in the DOM Toolbar.
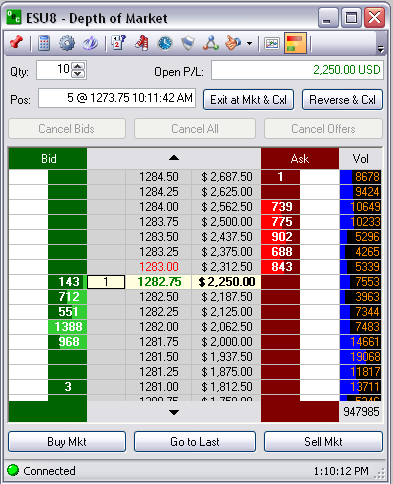
Refer to DOM Setup, Histogram Tab to select one of the three displays.
Left Figure is Volume Histogram.
Right Figure is Bid/Ask Histogram.
Lower Figure displays both types on the DOM.