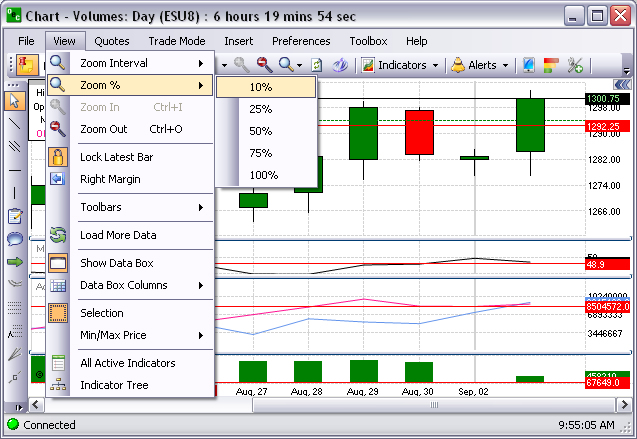
This View command displays a selected amount of the available data in the chart.
Click View, select the percent, and click to display the chart.
Refer to the Figures below that compare the displays, the Ten Percent (left) to the One Hundred Percent (right).