Click on View, select Indicator Tree from the drop-down to display the Indicator Tree window.
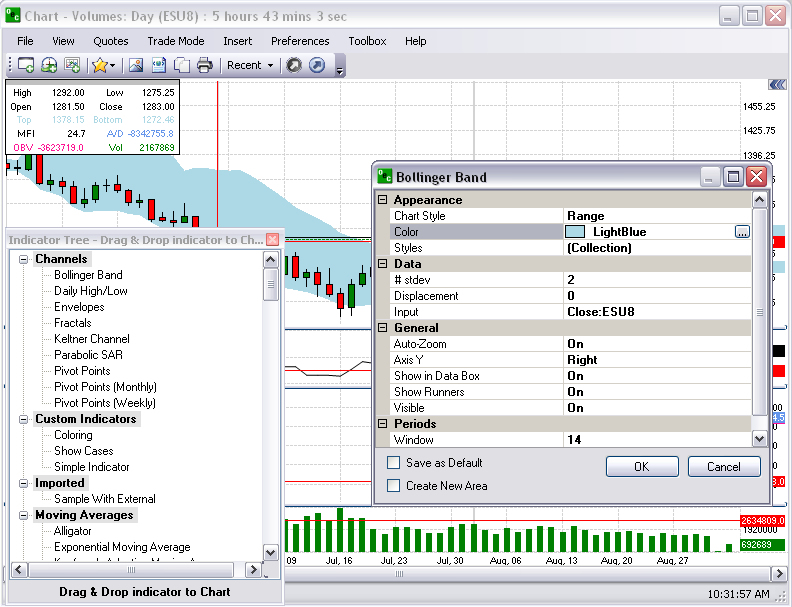
From the Indicator Tree window, click on an indicator, drag it onto the Chart (refer to the Figures below for example Bollinger Band.) to display the Bollinger Band window.
Click to check the box Create New Area for the graphic to display on the Chart, and click Ok. (The graphic displays on the bottom of the chart.)
To change the color of the new graphic, click inside the window under Appearance and Color.
Check Save as a Default to keep the new graphic on the Chart.
![]()
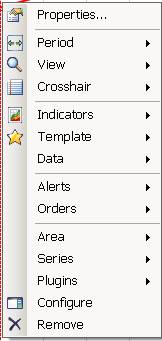
To delete the new graphic, select the item with the cursor, right-click on the mouse to display the Chart Properties window.
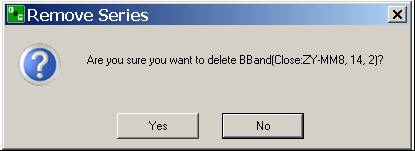
Click on Remove to display the Remove Series window and click Yes. Refer to the Figures below.