This is a graphical representation (Range Line/Spline Area chart) that displays a range of data by plotting two Y values per data point. Each Y value used is drawn as the upper, and lower bounds of an area. Refer to the Figure below.
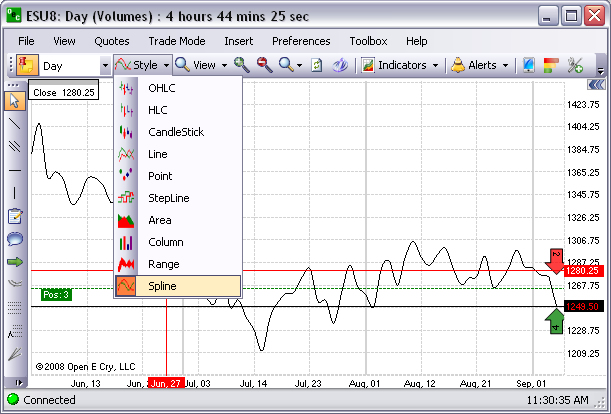
Under the Style menu, click Spline, to display the chart graphic.