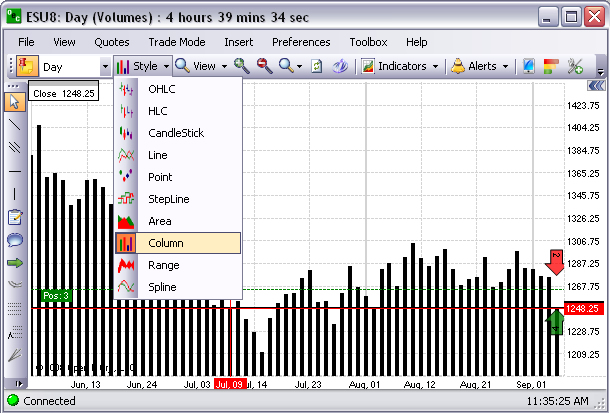
This is graphical representation similar to the area chart in that there is a specified series used to define scope of data. Refer to the Figure below.
Under the Style menu, Click Range to display the chart graphic.