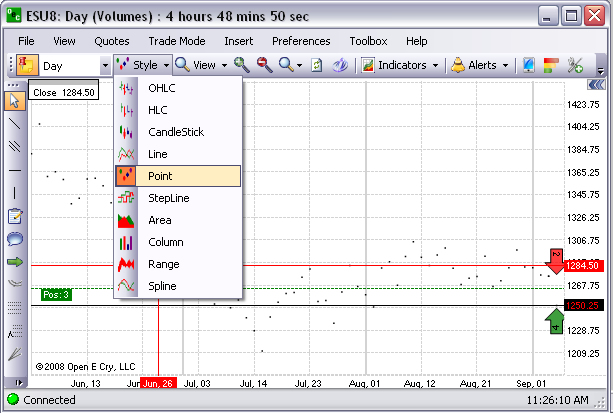
This is a graphical representation that only displays specific points on the chart.
Under the Style menu, click Point to display the chart graphic. Refer to the Figure below.