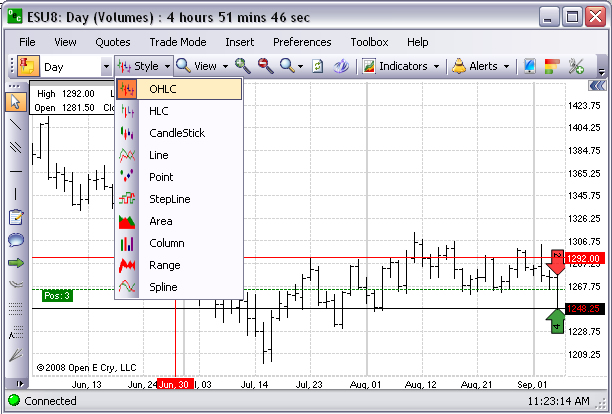
This is a graphical representation that displays the Tooltip in the upper left corner of Chart with the High and Low close information on the chart. Refer to the Figure below.
Under the Style menu, select OHLC to display the chart graphic.