This graphical representation displays properties of the series and is used with the View Min/Max price commands to freeze limits or to impose automated limits for a specific view.
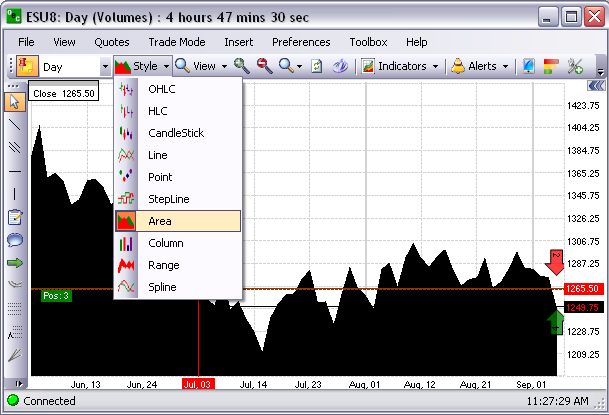
Under the Style menu, click Area to display the chart graphic. Refer to the Figure below.