The Range Chart refers to a graphic that displays market price data, with the opening and closing prices defining a rectangle within the range for each time unit.
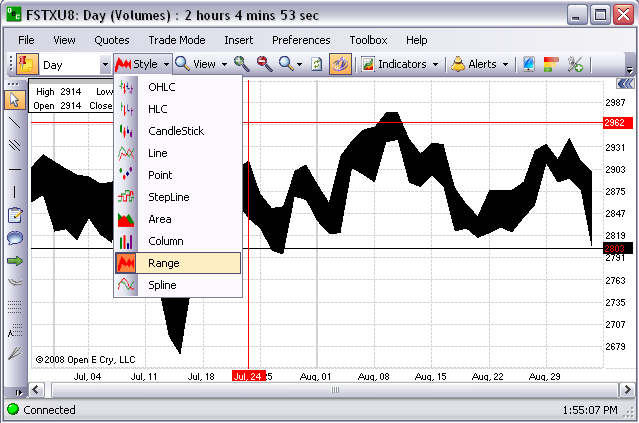
To display an Range Chart, under Style select the type from the drop-down menu. Refer to the Figure below.