The Point Chart plots day-to-day price movements without taking into consideration the passage of time. This type of chart is used to filter out non-significant price movements, and enables the trader to easily determine critical support and resistance levels. Traders will place orders when the price moves beyond identified support/resistance levels 3.
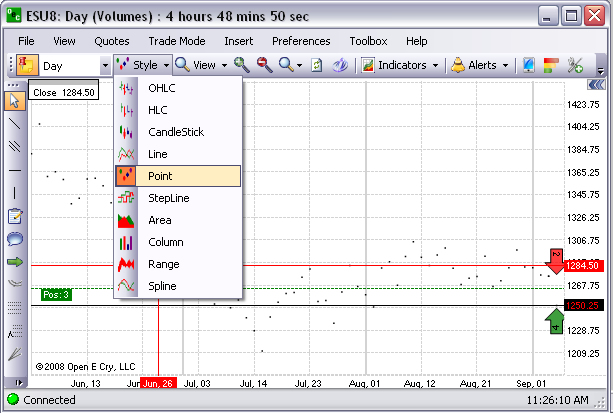
To display a Point chart, under Style select the type from the drop-down menu. Refer to the Figure below.