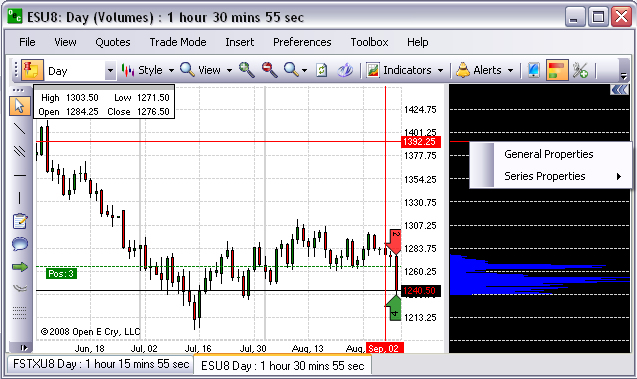
To display the Chart Properties (Preference Panel) from the histogram, right-click anywhere in the histogram to display the dialog box. Refer to the first Figure below.
Select General Properties to display the Chart Properties on the open chart. Refer to the lower Figure.
To close the histogram, click on the histogram icon in the toolbar.
To close the Chart Properties panel, click on the double arrows in the upper right corner of the panel. Refer to the second Figure below.
Cross Reference: Refer to the Charts Toolbox Chapter for more information on the Histogram.