The Line Chart is created by connecting a series of data points together with a line. This is the most basic type of chart used in finance and it is generally created by connecting a series of past prices together with a line. It displays a price of an asset for a specific timeframe3.
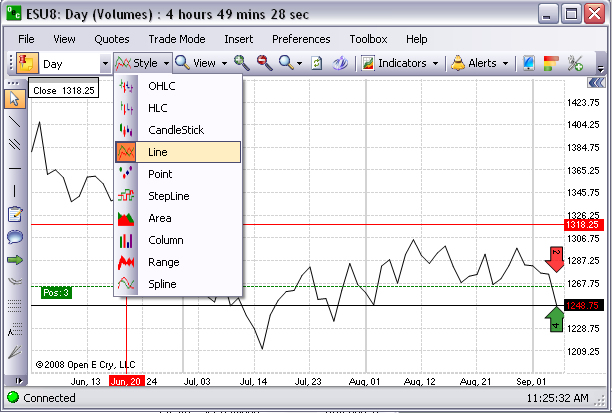
To display a Line chart, under Style select the type from the drop-down menu. Refer to the Figure below.