The Column Chart refers to a vertical graphic used to show comparisons between items of data.
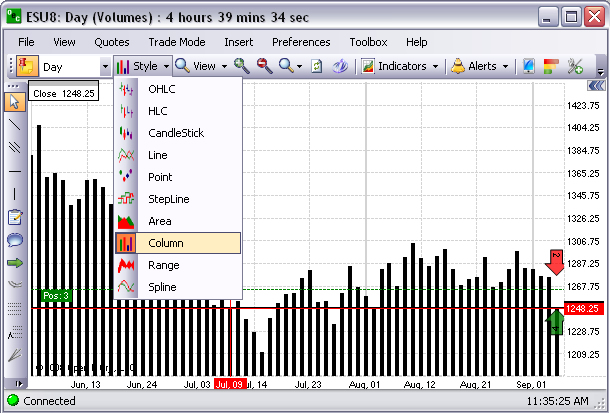
To display a Column Chart, under Style select the type from the drop-down menu. Refer to the Figure below.