
The Candlestick style (short for Japanese Candlestick) displays a price chart for high, low, open and close positions for a commodity each day over a specified period of time. For the ease of this example focus on candlesticks that are black and white (or blank and filled in). OEC Trader displays them in red or green. The blank or filled-in portion of the candlestick is called the real body. The thin lines coming from the top and bottom of the body are called shadows and show the high and low of the time period chosen. The line coming out of the top shows the high of the session and the one coming from the bottom shows the low. Refer to the Figure below is a zoom-in view of the Candlestick chart. 3
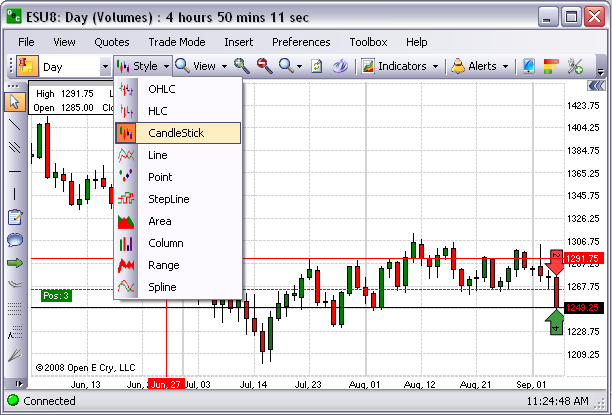
To display Candlestick, under Style select the type from the drop-down menu.
3 Investopedia.com