An Area Chart displays graphically quantitative data. It is based on the line chart. The area between axis and line are commonly emphasized with colors, textures and hatchings. Commonly one compares with an area chart two or more quantities.
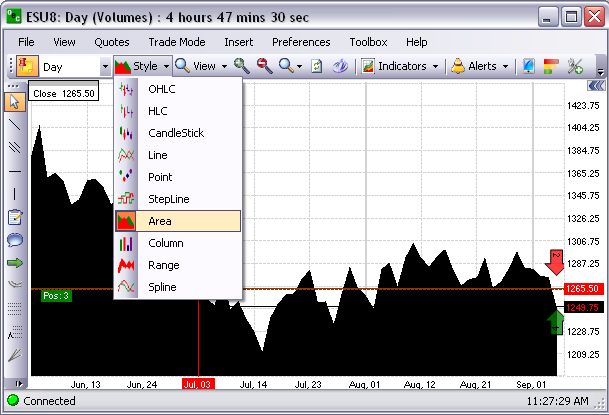
To display an Area Chart, under Style select the type from the drop-down menu. Refer to the Figure below.