|
Item |
Description & Default |
How to change |
|
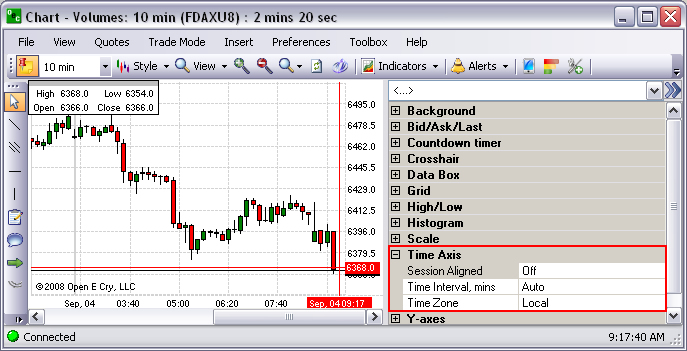
Time Axis |
Display graphic on chart. The right column is default. |
Refer to Show to remove. |
|
Session Aligned |
Show text color. Black is the default. |
Click for drop-down. |
|
Time Interval, mins |
Show interval minutes. Font-Sans Serif is the default. |
Click for font drop-down. |
|
Time Zone |
Show size display. 7 Regular is the default. |
Enter value. |
The Time Axis
To display the Preference Panel, click on Preference and select Chart Profile.
Under Size, enter numeric value for the dimension.
Click on Style to select a new design pattern from the drop-down menu .
Click on the double arrow [>>] in the upper right corner to close the Panel. Refer to the Figures below. Refer to the Figures below.