|
Item |
Description & Default |
How to change |
|
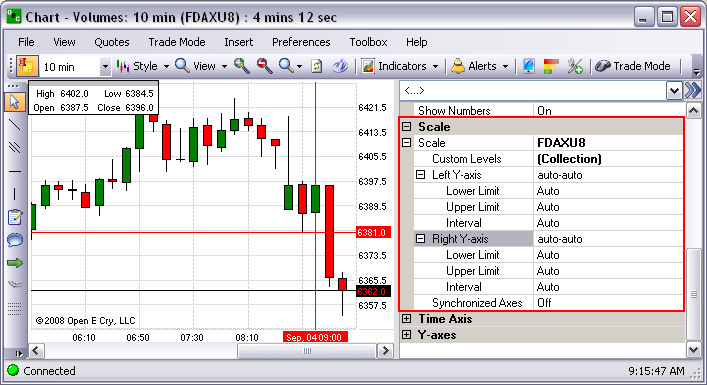
Scale |
Displays graphic on chart. The right side column is the default. |
Refer to Show to remove. |
|
Left Y-Axis |
Displays in a left vertical column on the chart. Default is off. |
Click for drop-down. |
|
Lower Limit |
Displays a specific value. Default is Auto. |
Click for drop-down. |
|
Upper Limit |
Displays a specific value. Default is Auto. |
Click for drop-down. |
|
Interval |
Display an incremental price. Default is Auto. |
Click for drop-down. |
|
Right Y-Axis |
Displays in a right vertical column on the chart. Default is on to display. |
Click for drop-down. |
|
Lower Limit |
Displays a specific value. Default is Auto. |
Click for drop-down. |
|
Upper Limit |
Displays a specific value. Default is Auto. |
Click for drop-down. |
|
Interval |
Display an incremental price. Default is Auto. |
Click for drop-down. |
|
Synchronized Axes |
Both left and right axis display same values. On is the default. |
Double-click for On/Off. |
A Scale Order is a type of order that comprises several limit orders at incrementally increasing or decreasing prices. If it is a buy scale order, the limit orders will decrease in price, triggering buys at lower prices as the price starts to fall. With a sell order, the limit orders will increase in price, allowing the trader to take advantage of increasing prices, thereby locking in higher returns.
To display the Preference Panel, click on Preference and select Chart Profile.
Under Size, enter numeric value for the dimension.
Click on Style to select a new design pattern from the drop-down menu .
Click on the double arrow [>>] in the upper right corner to close the Panel. Refer to the Figures below. Refer to the Figures below.