|
Item |
Description & Default |
How to change |
|
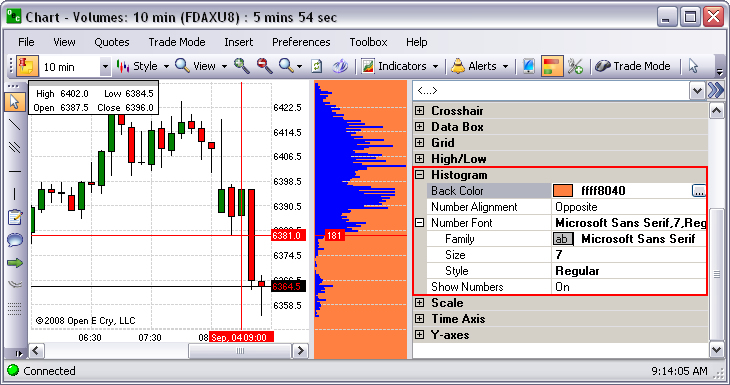
Back Color |
Display the background area. Black is the default. |
Click for drop-down. |
|
Number Alignment |
Display the placement location. Center is the default. |
Click for drop-down. |
|
Number Font |
Display Font, size and affect. Verdana, 7 Reg. is the default. |
Enter a value. |
|
Family |
Display the Font. Verdana is the default. |
Click for drop-down. |
|
Size |
Display the Size display. Seven (7) is the default. |
Click for drop-down. |
|
Style |
Affect display on chart. On is the default. |
Click for drop-down. |
|
Show Numbers |
Display on the chart display. On is the default. |
Click for drop-down. |
A Histogram is a graphical representation, similar to a bar chart in structure, that organizes a group of data points into user-specified ranges. The histogram condenses a data series into an easily interpreted visual by taking many data points and grouping them into logical ranges or bins.
To display the Preference Panel, click on Preference and select Chart Profile.
In the Chart Toolbar, click on the Histogram icon. (Place the cursor on any icon to display the name. )
Click on Back to select a new background color for the histogram.
Enter a numeric value to increase or decrease the size of the from the drop-down menu.
To increase or decrease the size of the histogram on the chart, click on the vertical border, hold down, and drag to the desired size. Refer to the black oval on the Figure below.
Click on the double arrow [>>] in the upper right corner to close the Panel. Refer to the Figures below. Refer to the Figures below.