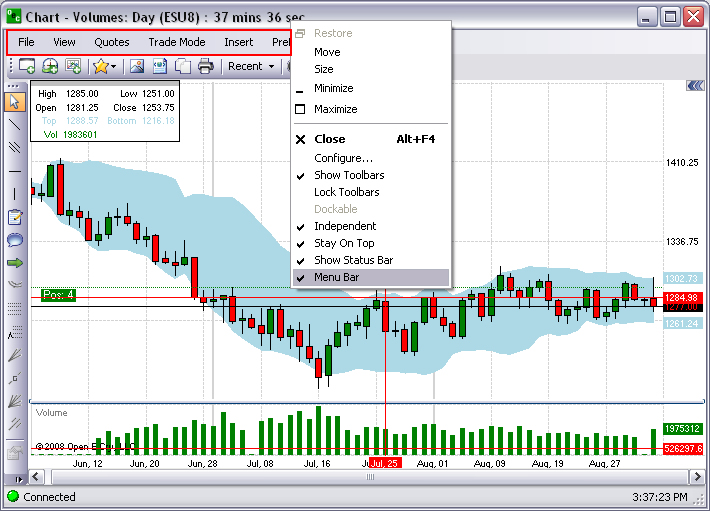
To display the Charts Main Menu Toolbar, right-click on the chart title bar and checkmark Menu Bar. Refer to the Figures below.
Note: This is a default and additional Tools cannot be added to the drop-down menus.
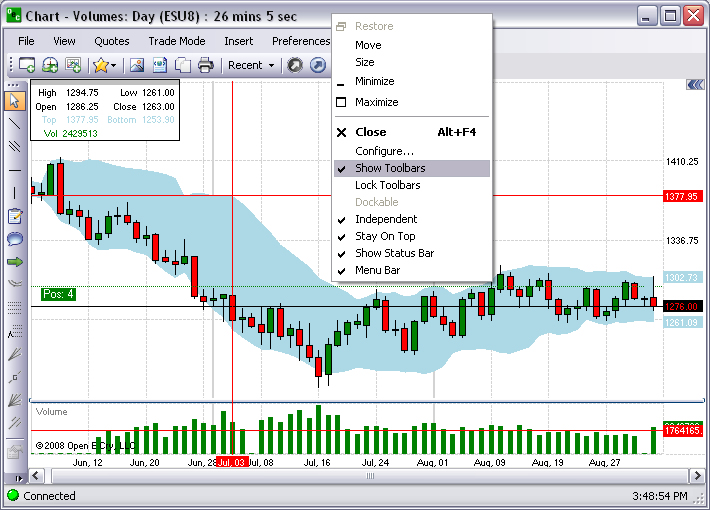
To display the Charts Default Toolbar (a submenu of tools located under the main menu), right-click on the chart title bar and checkmark Show Toolbars. Compare the Figures below
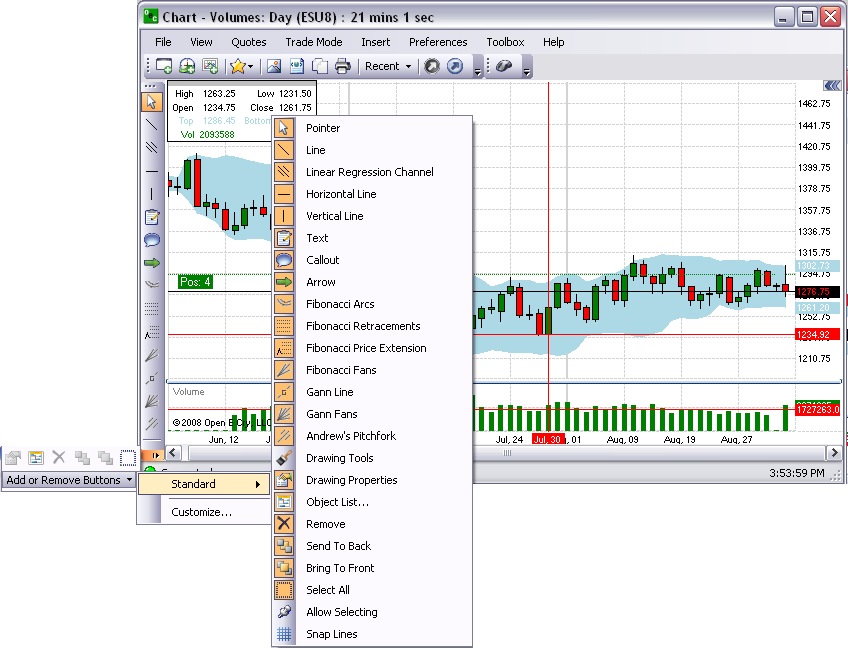
This command displays the icons and names for the Chart drawing tools. The Drawing tool display vertically on the left side of the chart. This section provides definitions for the different chart drawing tools in OEC Trader. Refer to the Figure below.
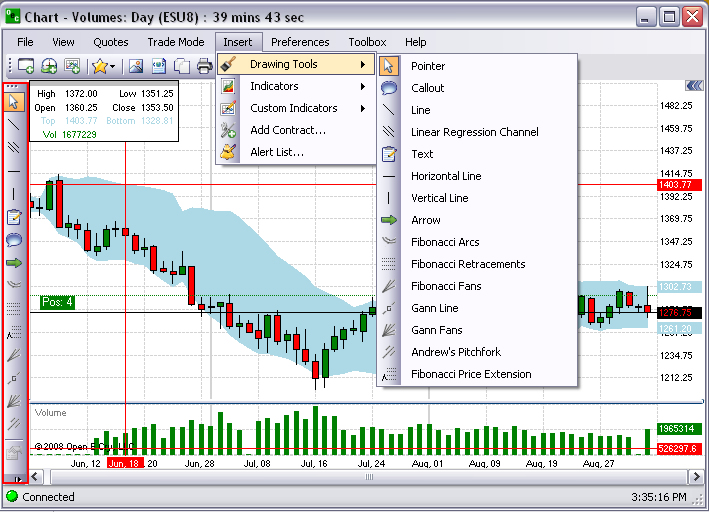
To display the Default Drawing Toolbar on the chart, click on Insert and select Drawing Tools to display them vertically on the left side. Refer to the Figure above.
The tools are presented in ascending order.
Term |
Description |
Allow
Selecting |
This command activates the mouse cursor to highlight a specific object in the chart with a single click to either click and drag it to a new location or to select it and delete it from the window. |
Andrew’s
Pitchfork |
This is a charting instrument consisting of three parallel Trend Lines and interpretation of Andrews’ Pitchfork is based on standard rules of interpretation of support and resistance lines. |
Arrow
|
This is a charting tool used to mark emphasis. |
Bring
to Front |
This command places the object in the forefront of the window. |
Callout
|
This is an Autoshape tool that includes text inside the textbox. |
Drawing
Properties |
This icon displays the drop-down menu of Drawing Tools (Standard). |
Drawing
Tools |
This is the icon used in OEC Trade to identify and display the Drawing Tools Standard Toolbar drop-down menu. |
Fibonacci
Arcs |
This is a charting tool that creates three curved lines that are drawn for the purpose of anticipating key support and resistance levels, and areas of range that are used to measure the different retracement levels within a market. |
Fibonacci
Fans |
This is a charting tool that creates three diagonal lines that use Fibonacci ratios to help identify key levels of support and resistance. |
Fibonacci
Price Extension |
In an uptrend, the general idea is to take profits on a long trade at a Fibonacci Price Extension Level. To determine the Fibonacci extension levels use three mouse clicks. First, click on a significant Swing Low, then drag the cursor and click on the most recent Swing High. Finally, drag the cursor back down and click on the retracement Swing Low. This displays each of the Price Extension Levels showing both the ratio and corresponding price levels. |
Fibonacci
Retracements |
This is a charting tool that places levels to correspond with percentage retracements that occur in the ebb and flow of a market trend. |
Gann
Fans |
This charting tool that creates multiple diagonal lines used to define a market direction or a new trend. |
Gann
Line |
This is a charting tool that creates a diagonal line with the slope of forty-five degrees that represents a long-term trendline (ascending or descending). While prices are above the ascending line, the market holds bull directions. |
Horizontal
Line |
This tool is limited to placing a line only on the horizontal axis. |
Line
|
This line is a free-floating tool that places the line in any direction, vertical, horizontal and diagonal. |
Linear
Regression |
This tool places a starting point on the graph and plots a diagonal (linear) line. |
Object
List … |
This command displays the Drawing Objects window that lists the properties of the saved objects. |
Pointer
|
This tool is used to select and highlight a particular area on the chart for closer examination. |
Remove
|
This command deletes the object from the window. |
Select
All (Selection) |
This command activates the mouse cursor to highlight an area in the window by moving the cursor from left to right and vice-versa. |
Send
to Back |
This command places the object in the background of the window. |
Snap
Lines |
This command aligns the object to the grid lines in a chart by using the mouse cursor. |
Text
|
This tool is a textbox that displays information on the chart. |
Vertical
Line
|
This tool is used to draw support and resistance lines on the chart and is limited to placing a line only on the vertical axis. |
To add a tool to the vertical Toolbar on the chart, press the Add or Remove Buttons Arrow.
Click on the icon to highlight and select it to display in the vertical column (left side) of the chart. Refer to the Figure below on the right. All selected icons display in the darker grey color.
Tools display as icons in the Arrow Standard drop-down menu when the window size is reduced. Refer to the lower right Figure that shows the selected tools that are not shown in the window.
In this example the Allow Selecting Tool has been added to the Toolbar.
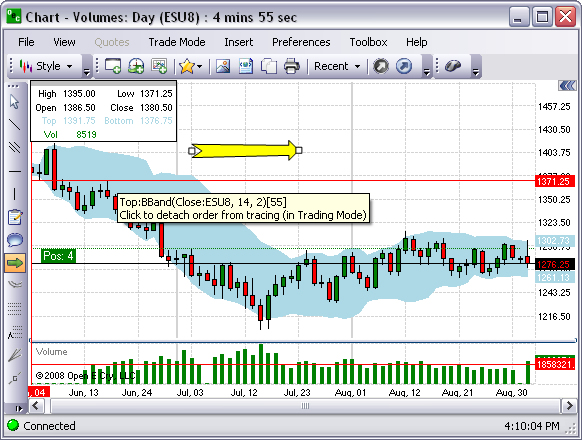
To move the Arrow, click and drag to a new location.
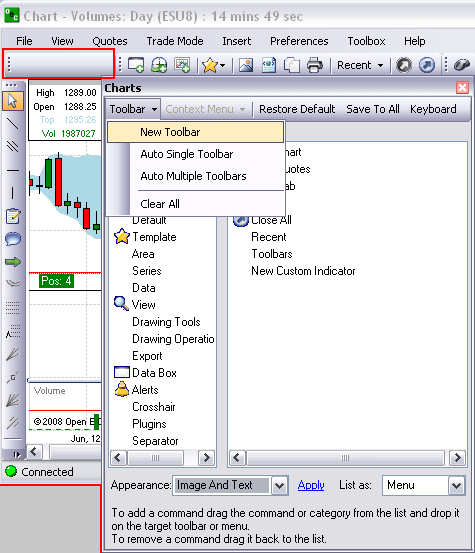
To create a Custom Toolbar, press the Add or Remove Buttons Arrow on the left vertical column on the chart.
Select Customize to display the Charts Context Menu.
Or, right-click on the vertical Toolbar and select Configure from the drop-down menu. Refer to the Figure on the far right.
Press Restore Default to display the Standard Drawing Tools.
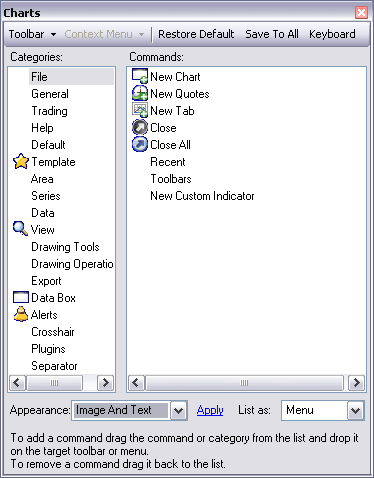
Under Categories, open a group of commands to display in the right panel. Compare the two lower Figures. The toolbar can be displayed on more than one row according to the menu selection.
To add a command, click and hold the command from the Panel list to drag and release it to the Toolbar menu location. Refer below to the Figure on the right.
To remove a command from the Toolbar, click and drag it back to the Panel list.
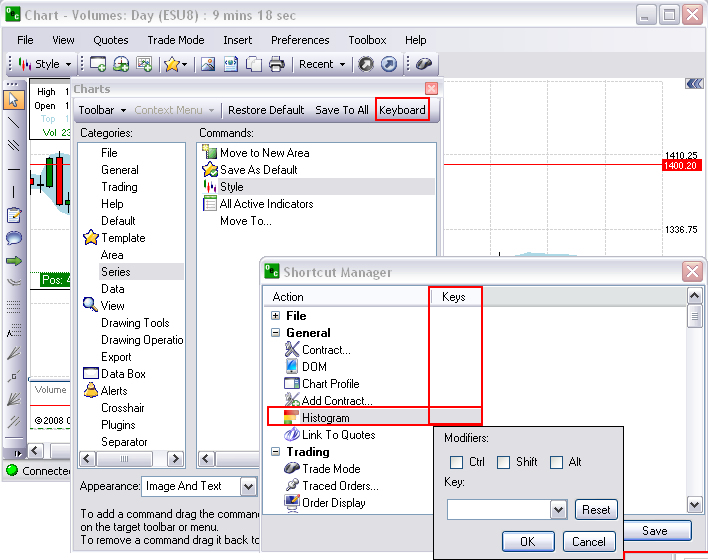
On the Charts window, click on Key board to display the Shortcut Manager window.
Click on the row of the custom item under the Keys column to display the Modifiers; window.
Select a key from the drop-down menu and checkmark to select a specific Control Key and click Ok to close the window.
Click on Save to close the Charts window. Refer to the Figures below.
This command activates the mouse cursor to highlight a specific object in the chart with a single click to either click and drag it to a new location or to select it and delete it from the window. For the illustration below the Show Tooltip is one. Refer to the Figures below.
Click on the Allow Selecting Tool to activate it. (It is now dark grey.)
Click on the Arrow to select it, place the mouse cursor on the chart, click and drag to the location. (The small squares on the sides indicate that the Arrow has been selected.)
To remove the Arrow, click on the Arrow to display the squares and press Delete to remove it from the chart. Refer to the Figures below.
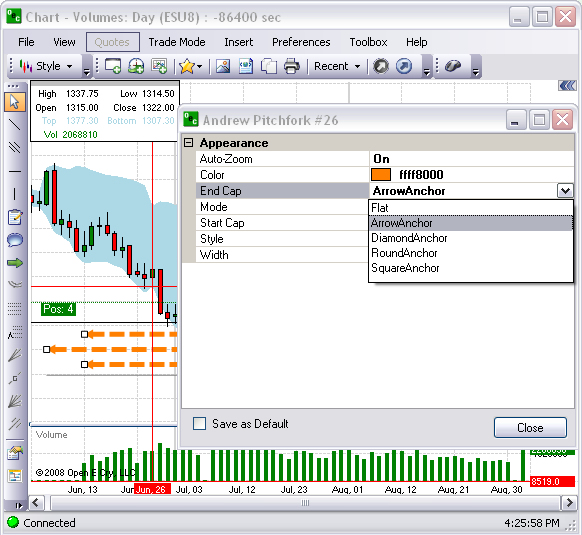
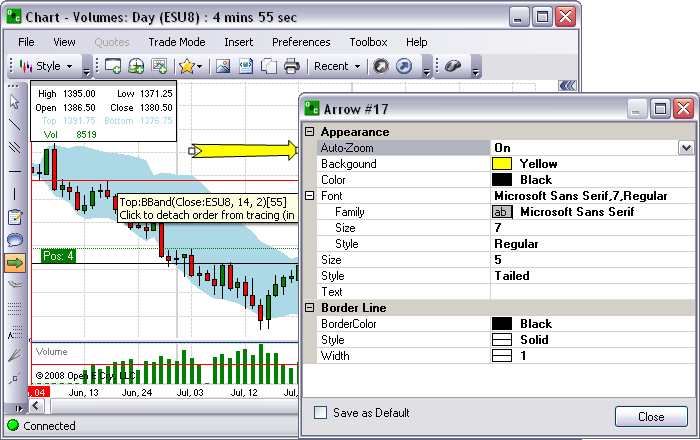
Many of the drawing tools can be visually customized. The specific variables in a Drawing Tool Properties window are configured in the same way across the platform. There are drop-down menus of selections to change the appearance of line width and style. There are Text fields to enter numeric values for; 1) Font size, Level figures (percentages, Sigmas, etc. Additionally, there is a Text field to enter information in a Text box that displays in a Callout or textbox on the chart. Refer to the Figures below.
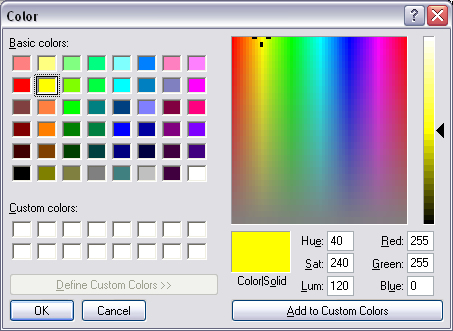
To change a custom color click on a white box under Custom Colors.
Select a hue from the Basic colors and click Add to Custom Colors fro the color to display in the Custom Colors.
Or, click inside the color palette window and move the vertical Arrow on the right side to the desired hue that displays in the Color/Solid box.
To select the new hue, click inside the Color/Solid square and click Add to Custom Colors.
To change the shape of a Start Cap or End Cap, click on the row to display the drop-down menu box.
Select and click on the preferred graphic.
To Save as Default, click to select and checkmark the box.
Click on Close to terminate the window. Refer to the Figures below.